Condition monitoring can help protect organizations against future problems, maximize equipment lifetime, and optimize operations.
Abhishek Jadhav
Product Manager
Dynapar Corporation
In today’s demanding production environment, manufacturers need to maximize productivity while minimizing cost of ownership. Condition monitoring provides a solution. Conditioning monitoring systems collect rich amounts of data that can be converted to reliable and surprisingly granular insights into equipment health. Properly analyzed, the data not only helps predict equipment failures in advance, it gives asset owners the freedom to address developing defects in the way that best suits their production needs and operational goals. Condition monitoring enables organizations to transition from reactive maintenance to predictive maintenance, preempting future problems while maximizing equipment lifetime. Operational equipment effectiveness (OEE) rises. Unplanned downtime becomes the exception rather than the rule. Strategically applied, condition monitoring can reduce downtime and downtime recovery to the point that asset owners can achieve ROI within a year or two.
A look at the most common condition-monitoring techniques for automated manufacturing shows how the data can be analyzed to deliver advance warning of developing issues, and some examples show how the information and the sensors can be applied to maintain productivity and equipment health.
Condition monitoring tools
Multiple aspects of machine operation can be studied for clues to the overall health of the equipment. The most common are:
- Ultrasonic testing – changes to the natural ultrasonic signals generated by moving equipment
- Oil analysis – particles from surface-to-surface contact and from oxidation; higher concentration correlates to increase damage
- Vibration analysis – changes to the vibration signature of the equipment as a result of damage
- Thermography – alterations to heat signatures introduced by increased friction due to wear
- Current analysis – increased current draw to supply torque to the load, typically caused by issues like lubrication breakdown, bearing defects, and gearbox wear
- Audible noise – noise caused by late-stage equipment issues such as defects, increased surface-to-surface contact, higher friction, etc.
Each technology has its strengths and weaknesses. For best results, the condition monitoring technique should be matched to the types of assets under consideration and the overall needs and business practices of the operation. The degree of advance warning provided is a key characteristic. Techniques like oil analysis can detect damage a year or more in advance of failure. For many maintenance departments, this is almost too early. They need enough warning to order parts and schedule the repair – weeks, or even a month or two. Anything more just clogs their inbox and adds additional tasks to the to-do list.

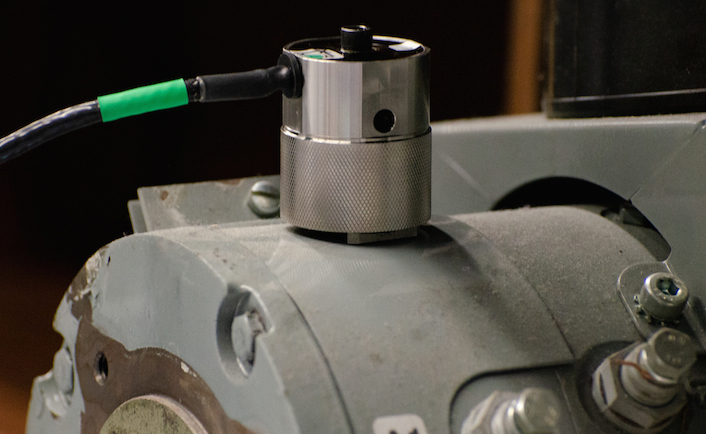
Condition monitoring systems such as this vibration monitoring unit from Dynapar allow organizations to preempt failure with ongoing insights into asset health.
The type of assets being monitored also comes into play. Some common assets that are critical to productivity include fans, pumps, blowers, dust collectors, and conveyors. In and of themselves, these units are not expensive but when they fail, they can stop the entire production floor. Among the most frequent causes of failure are bearings, which generate error signals that drop in frequency as the device continues to degrade. A condition-monitoring technique has to be able to detect these signals. Ultrasonic sensing only captures higher frequency signals and isn’t effective for detecting issues in a bearing that’s close to failure.
Thermography can identify the troubled asset (e.g. bearing, gear, motor, etc.) but it can’t provide any information beyond that. Vibration monitoring, on the other hand, can be very specific. In the hands of a vibration technician, vibration data can be used to not only isolate the problem as a bad bearing or gear, it can also be used to determine the exact cause, such as a cracked impeller blade or a broken gear tooth.Specificity is another important characteristic. Current sensing can be useful to flag a developing problem. If an asset suddenly begins drawing more current from the drive to generate enough torque to move the load, this indicates an issue. The cause can vary from lubrication breakdown to bearing defects to an over-tightened belt putting strain on the motor shaft. However, identifying the exact component responsible requires additional troubleshooting.
Particularly for rotating assets, vibration analysis is probably the best leading indicator of future issues. It provides highly specific advance warning, delivered in a timeframe that lets asset owners respond in the most effective way for their organization. When analyzed with additional data streams such as temperature readings and speed, vibration data can provide a detailed understanding of machine health and support predictive maintenance.
One of the key benefits of vibration monitoring is that it lends itself to continuous monitoring by software. The vibration technician configures automatic analytic tools and establishes thresholds that trigger the system to send automatic alerts whenever a condition is violated. The results of the analysis become portable, accessible by any user with permission, and available for collaborative decision-making.
How vibration data correlates to the physical system
Vibration is the response of machinery to an input stimulus. Any piece of equipment has a natural oscillation or frequency of vibration around its natural equilibrium. Vibration analysis provides a method for quantitatively understanding the motion of different components and how they affect the overall machine.
We can characterize vibration in terms of amplitude and frequency. This lets us view vibration amplitude as a function of time and frequency. Time waveforms are best for viewing assets operating at less than 100 rpm, and analyzing impact amplitudes in the case of bearing defect. Frequency spectra are better for determining the frequencies that exist in a system to help identify the source of a problem. Depending on the complexity of the system, it may be necessary to view the data in both time and frequency space to maximize information.
Phase analysis is an additional tool that can be used to discover issues that cause vibration at specific angular positions each rotation. This technique can be used to reveal problems with bearing concentricity, for example.
Vibration spectra consist of a combination of steady-state signals, which repeat continuously, and transient signals, which are generated as a result of specific stimuli. We can class peaks as synchronous, asynchronous, or sub-synchronous. At this point, the analysis begins to tightly correlate to the physical system.

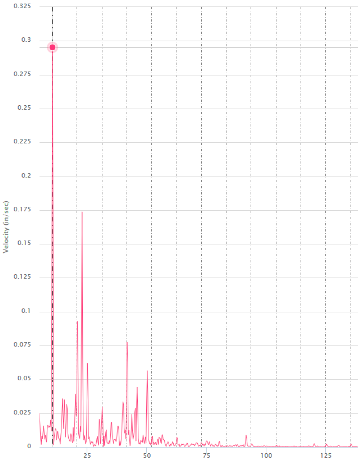
Vibration spectrum
for the outboard bearing of a fan shows a high 1X peak (red dot at left) and harmonics that represent the blades.
Synchronous peaks
Every rotating physical system has a fundamental vibrational frequency generated by the basic rotation. The frequency spectrum of the system will show a sharp peak at that fundamental frequency that is known as the 1X peak. The spectrum will also feature harmonics of the fundamental frequency, known as the 2X (twice the fundamental frequency), 3X (three times the fundamental frequency), and so on. These harmonics typically correlate to aspects of the physical system. A six-vane fan will generate a 6X peak, for example. Any changes to these components will add harmonics and change amplitudes
Asynchronous peaks
Vibration spectra also contain asynchronous peaks that are not whole number multiples of the fundamental frequency. Bearings, belts, and other components generate asynchronous peaks.
Sub-synchronous peaks
Vibration spectra can also include sub-synchronous vibration peaks, which are generated by components operating below the fundamental frequency and are 1/2, 1/3 or ¼ multiples of fundamental frequency. A loose belt on a motor shaft might generate a sub-synchronous spike. Some synchronous peaks also can be caused by bearing cage defects.
Analyzing the data
Vibration analysis begins with building a model of the system based on the components involved. A vibration expert can generate a theoretical spectrum; for example, including a peak at the fundamental frequency and additional peaks to represent fan blades, gearboxes, and other components.
The next step is to capture data from the physical system to build a baseline. Once the data has been digitized and converted to frequency space using a fast-Fourier transform (FFT), the spectrum can be compared to the model. If the two do not agree, there may be other physical factors that the model failed to take into account or there may already be issues. Let’s assume for the time being that the asset is healthy and the vibration spectrum is in good agreement with the model. Now the system should be set up for automatic (and frequent) data capture and analysis.
In the hands of a trained vibration technician, vibration data provides comprehensive information on asset health. Recall the above discussion of synchronous peaks. If the mechanics of the machine change, they will alter the vibration spectrum in well-understood ways that can be correlated with physical damage. A cracked impeller blade on our six-blade fan will significantly increase the amplitude of the 6X peak. As the issue worsens, the amplitudes will increase. A broken gear tooth will also generate a new harmonic of the fundamental frequency. A bearing-cage defect will manifest as a new sub-synchronous peak.

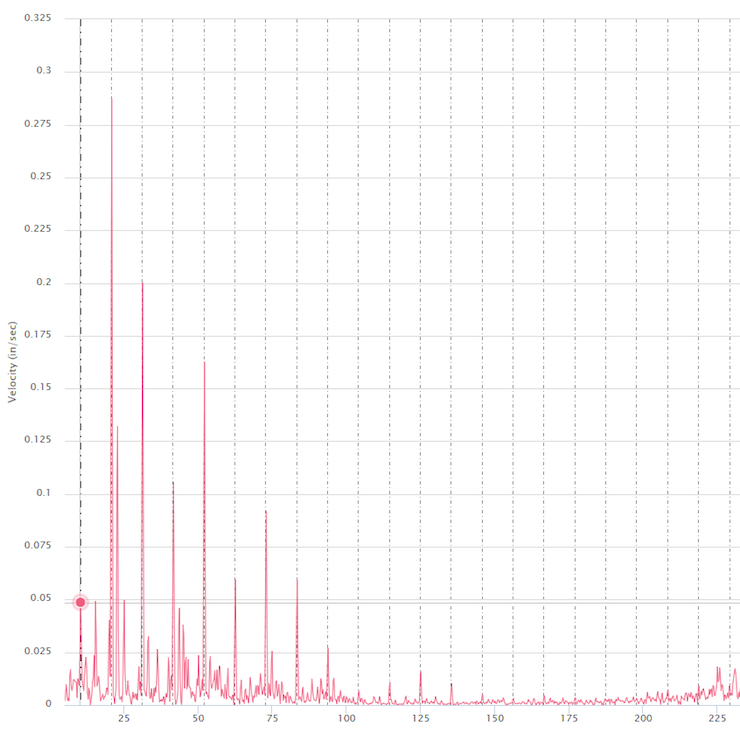
Vibration frequency spectrum of the same fan after development of a bearing defect shows a 98% reduction in the magnitude of the 1X peak (red dot at left), accompanied by significant increases in the 2X and 3X harmonics. The appearance of additional harmonics is caused by looseness in the bearing.
The combination of vibration spectrum, time waveform, and phase analysis can be used to reveal many types of issues, including:
- Damaged fans/pump blades
- Cracked or broken gear teeth
- Imbalanced loads
- Broken welds or bolts, detached rotor bars
- Misalignments
- Decentration between rotor and stator
- Resonances
Preventing future problems with vibration monitoring
The types of techniques described above can be used to improve productivity in a number of ways.
Closely monitor hard-to-reach assets
Online condition monitoring is particularly useful when applied to assets difficult to access using route-based techniques. Consider a food processor whose 100,000 sq-ft production facility was serviced by a single rooftop blower. Any time the blower failed, production had to halt, at a cost of more than $10,000 per hour. Catastrophic failure of the asset required removal by a rooftop crane. This added to both cost and duration of downtime. Manual condition monitoring was sporadic– the unit was difficult to monitor on hot days and impossible to access in winter, when the roof was covered with snow and ice. The company’s reliability service used route-based monitoring in the rest of the plant. For this asset, however, they installed a cloud-based vibration monitor to track a developing defect.
They configured the system to take continuous readings, sending alerts to key stakeholders anytime the vibration data exceeded certain thresholds. Less than two weeks after installation, the defect worsened. After consulting with their reliability expert, the operations team decided to continue production while ordering the parts required for repair. The continuous stream of data from the vibration monitor gave them the confidence to keep the asset running.
Three weeks later, the magnitudes of the vibration modes associated with the defect more than doubled. The blower was shut down at the end of the day shift and repaired overnight.
With remote vibration monitoring, the food processor is able to avoid the costs and delays of catastrophic bearing failure. In addition, they got an additional 43 days of service life from the bearing. They did not lose production time, pay extra fees for rapid part delivery, or suffer the downtime costs of recovering from catastrophic failure.

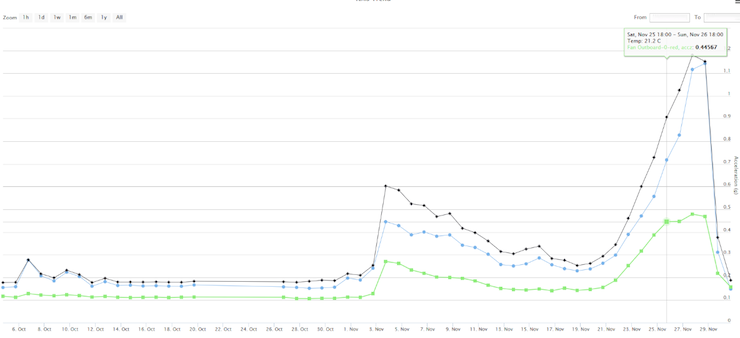
RMS trend of horizontal, vertical, and axial vibration of fan outboard bearing generated by the Dynapar OnSite Condition Monitoring System shows the emergence of the bearing defect.
Run troubled assets with confidence
Just because condition monitoring detects a problem, doesn’t mean the component has to be replaced immediately. One of the major benefits of online condition monitoring is that the visibility into asset health enables asset owners to choose how they want to respond to issues. One manufacturer of food-grade paper goods used online condition monitoring to protect its overall productivity. One of the rollers in the company’s primary paper line developed a bearing issue. The line operated 24/7 and fed all of the other lines in the facility. The company wanted to continue running the line until the next scheduled maintenance interval, but they needed to avoid catastrophic failure.
Frequent vibration analysis would make this possible, but the roll was difficult to access manually more than once a week. Instead, the company’s reliability expert recommended a cloud-based online vibration monitor, configuring it to capture data hourly and send alerts when conditions changed rapidly. The system continued to monitor the bearing as the condition worsened. Three weeks after the unit was put in place, the bearing was replaced during the scheduled maintenance period.
By installing a cloud-based vibration monitoring system on this unit, the manufacturer was able to continue operations, well preempting bearing failure.
Diagnose root cause
All data from continuous online condition monitors is time stamped, making it easy to correlate outside factors with any changes to asset condition. If the contributing factor is lubrication breakdown, for example, it’s possible to determine whether the lubrication interval needs to be altered or whether the issue was a support system such as an automatic lubrication system. The data provides maintenance and operations with better insights into actions that need to be taken to prevent future problems.
Confirm accurate installation of new equipment
Installation issues like bearing misalignments and decentration can be diagnosed from the vibration spectrum of an asset. If a spectrum of the healthy machine is captured and recorded, maintenance teams can use it as a basis of comparison for the vibration spectrum after repair. If a belt was overtightened, for example, the error can be corrected before it causes damage. The maintenance procedure can be amended to prevent a recurrence of the issue in the future.
These are just a few examples of how condition monitoring can help protect organizations against future problems, maximize equipment lifetime, and optimize operations. Online vibration monitoring and analysis, in particular, provides continuous granular detail on the health of even hard-to-reach rotating assets. By using vibration analysis as the central pillar of a condition monitoring program, and augmenting it with additional datatypes like temperature sensing, speed feedback, and others, organizations can enhance OEE and minimize cost of ownership for improved overall productivity.
Filed Under: Motion Control Tips


